
A Metabolic Profile of Polyamines in Parkinson Disease: A Promising Biomarker
Aging is the highest risk factor for Parkinson disease (PD). Under physiological conditions, spermidine and spermine experimentally enhance longevity via autophagy induction. Accordingly, we evaluated the ability of each polyamine metabolite to act as an age-related, diagnostic, and severity-associated PD biomarker. Methods: Comprehensive metabolome analysis of plasma was performed in Cohort A (controls, n = 45; PD, n = 145), followed by analysis of 7 polyamine metabolites in Cohort B (controls, n = 49; PD, n = 186; progressive supranuclear palsy, n = 19; Alzheimer disease, n = 23). Furthermore, 20 patients with PD who were successively examined within Cohort B were studied using diffusion tensor imaging (DTI). Association of each polyamine metabolite with disease severity was assessed according to Hoehn and Yahr stage (H&Y) and Unified Parkinson’s Disease Rating Scale motor section (UPDRS-III). Additionally, the autophagy induction ability of each polyamine metabolite was examined in vitro in various cell lines. Results: In Cohort A, N8-acetylspermidine and N-acetylputrescine levels were significantly and mildly elevated in PD, respectively. In Cohort B, spermine levels and spermine/spermidine ratio were significantly reduced in PD, concomitant with hyperacetylation. Furthermore, N1,N8-diacetylspermidine levels had the highest diagnostic value, and correlated with H&Y, UPDRS-III, and axonal degeneration quantified by DTI. The spermine/spermidine ratio in controls declined with age, but was consistently suppressed in PD.
Among polyamine metabolites, spermine was the strongest autophagy inducer, especially in SH-SY5Y cells. No significant genetic variations in 5 genes encoding enzymes associated with spermine/spermidine metabolism were detected compared with controls. Interpretation: Spermine synthesis and N1,N8-diacetylspermidine may respectively be useful diagnostic and severityassociated biomarkers for PD. Aging is the major risk factor for many chronic disorders, including diabetes mellitus, cancer, cardiovascular diseases, and neurodegenerative diseases including Parkinson disease (PD), whose current treatment is limited to symptomatic relief.1–3 Because PD prevalence increases with age, the number of PD patients is estimated to double from 6.9 million in 2015 to 14.2 million in 2040.4 Although agerelated molecular mechanisms of PD (eg, dopamine metabolism, iron accumulation, mitochondrial DNA changes, and decreased protein-degradation efficiency) have been proposed,5 no corresponding blood biomarkers have been validated for widespread clinical use. Blood-based biomarkers associated with aging-related risk for PD would enable efficient monitoring of the disease process and could be used for development of therapies.Polyamines are ubiquitous small polycations that ionically bind to various negatively charged molecules and have many functions, mostly linked to cell growth, survival, and proliferation.6 Prime examples of polyamines are putrescine, spermidine (Spd) and spermine (Spm), whose levels are strictly controlled. Putrescine is sequentially converted into Spd and Spm by Sadenosyl-L-methionine decarboxylase and Spd/Spm synthase.
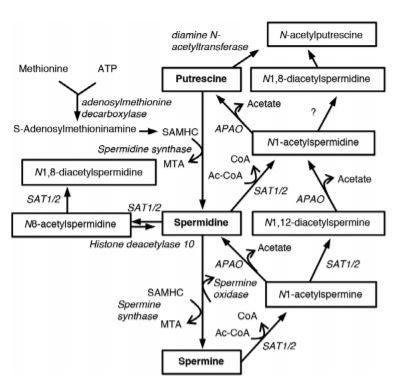
Consecutively, Spd is converted to Spm by Spm synthase, and vice versa by Spm oxidase (Fig 1). N1-acetylspermine (N1- AcSpm) and N1-acetylspermidine (N1-AcSpd) are synthesized by the transfer of an acetyl group from acetyl-coenzyme A to the N1-position of either Spd or Spm, respectively, which is catalyzed by Spd/Spm acetyltransferase 1 or 2 (SAT1/2). In addition, N8-acetylspermidine (N8-AcSpd), N1,N8-diacetylspermidine (DiAcSpd), and N1,N12-diacetylspermine (DiAcSpm) are produced by acetylation of Spd, N1-AcSpd, N8-AcSpd, and N1-AcSpm, respectively.7 Spd and Spm have been shown to increase the lifespan of different species and improve neural functions via enhancement of autophagy in Caenorhabditis elegans, Drosophila, and mice.6,8 Autophagy is an evolutionarily conserved lysosomal degradation pathway associated with the pathogenesis of aging-related neurodegeneration as it loses efficiency in aging organisms.Human whole blood concentrations of Spd and Spm are kept strictly within the 4 to 40μM range.9–11 Levels of Spd and Spm are lower in 60- to 80-year-olds than in 31- to 56-year-olds.12 In the rat cerebral cortex and human basal ganglia, the levels of Spd and Spm decrease with age.13 Although it is not fully understood how brain polyamine levels are associated with levels in peripheral blood, levels in both the brain and blood decrease with age. In PD patients, levels of putrescine and N1-AcSpd significantly increase in cerebrospinal fluid (CSF), whereas concentration of Spd is reduced.14 In addition, serum N8-AcSpd levels are increased in PD patients with a malignant phenotype.
Based on partial polyamine data in PD using a previously reported cohort,16 we investigated polyamine metabolic changes in a novel PD cohort by comparing tauopathies, specifically, progressive supranuclear palsy (PSP) and Alzheimer disease (AD) as disease controls.
Subjects and Methods
Ethics Statement
This study protocol complied with the Declaration of Helsinki and was approved by the ethics committee of Juntendo University (#2012157). Written informed consent was obtained from all participants.
Participants
All participants were recruited at the Juntendo University Hospital and examined by board-certified neurologists. Cohort A (previously reported as “2nd cohort” in our report16) and Cohort B were independently recruited from December 2014 to February 2015 and from December 2016 to January 2017, respectively. PD, PSP, and AD were diagnosed according to the well-established criteria for each disease.17–19 We excluded PD patients with possible dementia (Mini-Mental State Examination score < 24) to avoid substantial overlap between PD with possible dementia and AD. Neither patients nor controls had a history of tumors, cancer, aspiration pneumonia, or inflammatory diseases including collagen vascular diseases. Participants suffering from acute infectious diseases or acute/chronic renal or hepatic failure at the time of sample collection were also excluded. Disease duration means the time since initial motor symptoms of PD. Hoehn and Yahr stages (H&Y) and Unified Parkinson’s Disease Rating Scale motor section (UPDRSIII) scores were defined during the “on phase” for practical and ethical reasons.
UPDRS-III score in Cohort B may be at a lower level because of the preserved general physical status without any critical illness. L-dopa equivalent dose (LED) was calculated based on a previous report.
Sample Collection
Sample collection was performed from December 2014 to February 2015 and from December 2016 to January 2017 for Cohorts A and B, respectively. Plasma and serum were extracted as described previously.16 Each 500μl of plasma or serum aliquot was stored in a −80C freezer until use. Sample preparation followed by immediate mass spectrometry analysis of Cohorts A and B were performed in February 2015 and April 2017, respectively.
Sample Preparation
Polyamine metabolites were extracted as described previously.21 Briefly, 200μl of serum was immediately added to 200μl of 10% trichloroacetic acid containing 10pmol of N1-AcSpd–d6 (Toronto Research Chemical, Toronto, Ontario, Canada) as an internal standard. The solution was centrifuged at 15,000 rpm for 15 minutes at 4C, and the upper aqueous layer was collected. The sample was dissolved in 50μl of Milli-Q water after lyophilizing, and 10μl was used for liquid chromatography–mass spectrometry (LC-MS). The concentration of each compound was estimated by its peak area of selected reaction monitoring (SRM) relative to that of the internal standard (N1-AcSpd-d6).
Metabolome Analysis
Capillary Electrophoresis Time-of-Flight MS and LC Time-ofFlight MS. Using capillary electrophoresis time-of-flight MS and LC time-of-flight MS with Advanced Scan Plus (Human Metabolome Technologies, Yamagata, Japan), comprehensive metabolome analysis was conducted based on methods described previously.
LC-MS of Detailed Polyamine Metabolites. Spd, Spm, and their acetylated metabolites were separated by highperformance LC (HPLC; Gilson, Middleton, WI) using a Develosil ODS UG3 column (150 × 2.0mm, 3μm particle; Nomura Chemical Co, Aichi, Japan). LC conditions were modified from a method reported previously.22 Briefly, we used 0.1% HCOOH/0.05% heptafluorobutyric acid (HFBA)/H2O as mobile phase A and 0.1% HCOOH/ 0.05% HFBA/80% acetonitrile as mobile phase B, with a flow rate of 150μl/min. The HPLC system was connected to a TSQ Quantum Ultra AM mass spectrometer (Thermo Fisher Scientific, Waltham, MA). Target compounds were analyzed in the SRM positive-ionization mode.
Diffusion Tensor Imaging
Diffusion tensor images were acquired from 20 PD patients successively examined (3.06 0.822 months after blood sampling) within Cohort B on a 3.0T system (Achieva; Philips Healthcare, Best, the Netherlands) with an 8-channel phased-array head coil for sensitivity encoding parallel imaging. Whole brain images were obtained using spin-echo echo planar imaging (EPI) with (1) 32 uniformly distributed direction diffusion-encoding (b = 1,000 s/mm2 for each direction), and (2) no diffusion weighting (b = 0 s/mm2 ) in an anterior–posterior phase-encoding direction. Standard- and reverse-phase encoded blipped images with no diffusion weighting were also acquired to correct for magnetic susceptibility-induced distortions related to EPI acquisitions.The scanning parameters were repetition time = 9,810 milliseconds, echo time = 100 milliseconds, field of view = 256 × 256mm, matrix size = 128 × 128, slice thickness = 2mm, number of slices = 75, orientation = axial, and scanning time = 6.50 minutes.
Diffusion tensor imaging (DTI) datasets were checked visually in all 3 orthogonal views. No dataset had severe artifacts related to gross geometric distortions, bulk motion, or signal dropout. Data were corrected for susceptibility-induced geometric distortions, eddy current distortions, and intervolume subject motion using the EDDY and TOPUP toolboxes.23 Tensors were computed at each voxel by fitting a tensor model to diffusionweighted images with b = 0 and 1,000 s/mm2 . Once the tensor was estimated, fractional anisotropy (FA), mean diffusivity (MD), axial diffusivity (AD), and radial diffusivity (RD) were estimated based on standard formulae.
DTI Image Processing Using Tract-Based Spatial Statistics Analysis
Whole-brain voxelwise analysis of all diffusion tensor–derived measurements was performed using tract-based spatial statistics (TBSS) implemented with FMRIB Software Library 5.0.9 (FSL, Oxford Centre for Functional MRI of the Brain, Oxford, UK; www.fmrib.ox.ac.uk/fsl).25 Briefly, FA images of all subjects were registered into FMRIB58_FA standard-space images with the nonlinear registration tool FNIRT, followed by visual inspection to ensure registration quality. Then, mean FA images were created by averaging registered FA images. Furthermore, mean FA images were thinned to generate a mean FA skeleton representing the centers of all tracts of groups.Aligned FA images from each subject were projected onto the mean FA skeleton using a lower threshold of FA = 0.2 to exclude peripheral tracts and gray matter. By applying the original nonlinear registration warping field of each subject’s FA to the standard space, MD, AD, and RD were also projected onto the mean FA skeleton.
Furthermore, MD, AD, and RD data were also used to calculate voxelwise statistics. Anatomical locations of regions with significant correlations in the white-matter skeleton were identified by the Johns Hopkins University DTI white matter atlas within FSL.26 In addition, average diffusion metrics of clusters that showed significant correlation by TBSS analysis were measured.
Genomic DNA Analysis
DNA was extracted from peripheral blood using a Qiagen Kit (Qiagen, Venlo, the Netherlands). To rule out the possibility that Spd and/or Spm metabolism is changed by SAT2 or histone deacetylase 10 (HDAC10),27,28 genetic screening of SAT1, SAT2, and HDAC10 were performed. Eighteen single-nucleotide variants (SNVs) present in >1% of the Japanese population were chosen based on the Integrative Japanese Genome Variation Database (iJGVD). Of these, 16 SNVs (rs13894, rs858521, rs858520, and rs139435483 of the SAT2 gene; rs75596977, rs5771271, rs76578729, rs77096954, rs4838866, rs35820251, rs41283469, rs738334, rs1555048, rs150016700, rs77003572, and rs76662439 of the HDAC10 gene) were examined using the QuantStudio 7 Flex Real-Time PCR System (Thermo Fisher Scientific) with TaqMan genotyping assays (Thermo Fisher Scientific). The final volume was 10μl, consisting of 5μl TaqMan GTXpress Master Mix, 0.5μl TaqMan genotyping assay, 2.5μl nuclease-free water, and 2μl genomic DNA in each well of a 96-well plate. Realtime polymerase chain reaction (PCR) steps included an initial enzyme activation step at 95C for 20 seconds, followed by 40 cycles of a denaturation step at 95C for 1 second and an annealing/extension step at 60C for 3 seconds.
The other SNVs (rs11553697 and rs2294404 of the HDAC10 gene29) and all cording exons and exon-intron boundaries of SAT1, spermine synthase (SMS), and spermine oxidase (SMOX) genes were sequenced using the Sanger method with BigDye Terminators v3.1 Cycle Sequencing Kit and 3130 Genetic Analyzer (Life Technologies, Foster City, CA) PCR, and sequencing primers were designed by Primer 3. Frequencies of analyzed SNVs were referred to gnomAD (https://gnomad.broadinstitute.org/) and compared with iJGVD for the Japanese population (https://ijgvd.megabank. tohoku.ac.jp). Pathogenicity of identified missense variants was determined using the sorting-intolerant-from-tolerant method.30 Frequencies of each variant were evaluated using the Exome Aggregation Consortium database (http://exac.broadinstitute.org/).
Materials
Spd, Spm, N1-AcSpd, N8-AcSpd, putrescine, and bafilomycin A1 were purchased from Sigma-Aldrich (St Louis, MO). N1-AcSpm, DiAcSpm, and DiAcSpd were purchased from Wako Pure Chemical Industries (Osaka, Japan).
Cell Culture
Human neuroblastoma SH-SY5Y cells were cultured in Dulbecco modified Eagle medium (DMEM) medium supplemented with 10% fetal bovine serum (FBS), 100U/ml penicillin/streptomycin (Nakarai Tesque, Kyoto, Japan), MEM Non-Essential Amino Acids Solution (Thermo Fisher Scientific), 1mM sodium pyruvate, and 2mM L-glutamine, at 37C in 5% CO2 and 95% atmospheric air.
Human adenocarcinoma HeLa cells, human colon cancer LoVo cells, human hepatocyte carcinoma HepG2 cells, and human embryo kidney HEK293T cells were cultured in DMEM supplemented with 10% FBS and 100U/ml penicillin/streptomycin. Human umbilical vein endothelial cells were cultured in HuMedia-EG2 (Kurabo, Osaka, Japan), and human osteosarcoma U2OS cells were cultured in McCoy’s 5A (Modified) Medium (Thermo Fisher Scientific) supplemented with 10% FBS and 100U/ml penicillin/streptomycin.
Western Blotting
Western blot analysis was performed as previously described,31 with slight modifications. Cells were lysed in buffer (25mM Tris-HCl pH 7.6, 150 mM NaCl, 1% NP-40, 1% sodium deoxycholate, 0.1% sodium dodecyl sulfate [SDS], and protease inhibitor cocktail) for 15 minutes on ice and centrifuged at 15,000 rpm for 15 minutes to yield soluble cell lysates. For immunoblotting, 20μg of cell lysate proteins were subjected to 10 to 20% gradient SDS–polyacrylamide gel electrophoresis. Proteins were transferred onto polyvinylidene fluoride membranes and probed with specific antibodies. This was followed by detection using West Dura Extended Duration Substrate (Thermo Fisher Scientific) and the LAS-4000 Mini (GE Healthcare UK, Little Chalfont, UK). The primary antibodies used were anti–microtubuleassociated protein light chain 3 (LC3B; Cell Signaling Technology, Danvers, MA), and anti–β-actin (EMD Millipore Co, Billerica, MA).
Statistical Analysis
When a value was below the limit of detection, it was assigned half the minimum value of its compound. Wilcoxon tests were used to compare all individual analyses between controls and PD patients. Steel test is a nonparametric, multiple-comparison test, and was used to compare patients stratified by H&Y (I, II, III, and IV) and controls, or by PD, de novo PD, PSP, or AD and controls. Receiver operating characteristic (ROC) curve analysis was performed using JMP13 (SAS Institute, Tokyo, Japan). Optimal cutoff values and area under the curve (AUC) were calculated using Youden index maxima (sensitivity + specificity − 1).32 Pearson correlation coefficients were used to examine relationships between serum metabolite levels and LED or UPDRS-III in PD using JMP13. Conditional logistic regression analyses were used to calculate odds ratios and 95% confidence intervals for allelic and genotypic correlations with PD risk. Allele frequencies were analyzed with Pearson chi-squared test. Probability of p < 0.05 was considered statistically significant. The Randomize tool (https://fsl.fmrib.ox.ac.uk/fsl/fslwiki/ Randomise) was used to examine relationships between diffusion metrics and blood metabolites (DiAcSpd, N8-AcSpd, DiAcSpm, and Spm/Spd ratio) by multiple linear regression analysis. A general linear model was created for analysis of covariance (ANCOVA), with age and LED as nuisance covariates to adjust for their potential confounding influence on DTI measurements. To avoid selection of an arbitrary cluster-forming threshold, the threshold free cluster enhancement option was used in Randomize. In total, 5,000 permutations were generated to provide an empirical null distribution of maximal cluster size.
33 For free water elimination, p < 0.05 was considered significant for TBSS. In addition, mean diffusion tensor–derived measurements of significant clusters were correlated with blood metabolites using Spearman rank correlation test, with significance defined at p < 0.05.
Results
Two Acetylation Forms, N8-AcSpd and NAcetylputrescine, Correlated with PD Severity in Cohort A
Comprehensive metabolome analysis using Cohort A (named “2nd cohort” in our previous report16) showed elevated N8-AcSpd (ratio of PD to control = 1.44, p = 0.0036) and N-acetylputrescine (N-AcPut; ratio of PD to control = 1.20, p = 0.126) in PD relative to healthy controls. Levels of the other polyamine metabolites were below the detection limit.16 Both N8-AcSpd and N-AcPut positively correlated with H&Y (N8-AcSpd, p < 0.0001; N-AcPut, p = 0.0002), UPDRS-III (N8-AcSpd, p < 0.0001; N-AcPut, p = 0.0002), age at sampling (hereafter simply referred to as “age”; N8-AcSpd, p = 0.0007; N-AcPut, p < 0.0001), and LED (N8-AcSpd, p = 0.0018; N-AcPut, p < 0.0001).Age and LED strongly correlated with H&Y (age, p = 0.0053; LED, p < 0.0001). Thus, to exclude interactions of LED or age with both acetylated polyamines, we performed multiple regression analyses and found that N8-AcSpd significantly correlated with H&Y (LED, p < 0.0001) and mildly with UPDRS-III (LED, p = 0.0517).Meanwhile, N-AcPut mildly correlated with H&Y (LED, p = 0.0667) and UPDRS-III (LED, p = 0.0932). However, N8-AcSpd and N-AcPut significantly correlated with H&Y (age, p < 0.0001 and p = 0.0036, respectively) and UPDRS-III (age, p = 0.0004 and p = 0.0042, respectively).
DiAcSpd Correlates with Severity of PD
Further exploration of polyamine metabolic changes in PD incorporated a larger validation cohort (Cohort B), including tauopathy disease controls (PSP and AD; Table 1, Cohort B). In Cohort B, we performed serum analysis, as it enabled us to perform more sensitive analysis of Spm and Spd with similar sensitivity to their acetylated forms compared with plasma analysis (data not shown). As expected, most acetylated polyamine forms were significantly elevated in PD (Table 2). Importantly, Spd was significantly higher in PD than controls, whereas Spm was significantly lower in PD. A similar tendency in levels of each polyamine metabolite was also detected in 4 de novo PD patients. As shown in Figure 2A–G, DiAcSpd, N8-AcSpd, and DiAcSpm positively correlated with H&Y, UPDRS-III (DiAcSpd, p = 0.0023; N8-AcSpd, p = 0.0046; DiAcSpm, p = 0.0103), and LED (DiAcSpd, p = 0.0043; N8-AcSpd, p = 0.0029; DiAcSpm, p = 0.00223). ROC curve analysis with these 7 metabolites showed a high diagnostic value (see Fig 2H) similar to DiAcSpd (AUC = 0.946, cutoff value = 0.821). Furthermore, these polyamine metabolites had robust diagnostic power for differentiating PD from PSP (AUC = 0.931, cutoff value = 0.805) and AD (AUC = 0.938, cutoff value = 0.801).As in Cohort A, age, disease duration and LED positively correlated with H&Y stage (age, p < 0.0001; disease duration, p < 0.0001; LED, p < 0.0001); therefore, logistic regression and multiple regression analyses were performed to exclude their influence for accurate assessment of the relationship between acetylated polyamines and disease severity.
Positive correlations of disease severity with DiAcSpd were detected under normalization of both LED (Table 3) and age (Table 4). Likewise, ANCOVA showed that the levels of 3 acetylated polyamines were significantly elevated in association with age in PD relative to controls (DiAcSpd, p = 0.0056; N8-AcSpd, p = 0.0468; DiAcSpm, p = 0.0018), which was partially consistent with a previous report.12 To confirm that these polyamine metabolites reflect disease severity of PD, we performed DTI on 20 patients with PD who were successively examined within Cohort B. As shown in Table 5, no significant differences were observed for any clinical characteristics and polyamine metabolite levels between PD patients and PD patients with DTI. Using DTI, we investigated association between levels of the 3 acetylated polyamines and axonal changes detected in PD.34 Accordingly, TBSS analysis detected a significant positive correlation between DiAcSpd and FA in an extensive white matter area in the brain of PD patients after normalization of LED and age (see Fig 2I, J; p < 0.05, familywise error-corrected; Peak Montreal Neurological Institute method x, y, z: 77, 90, 110; tmax = 7.06; rmax = 0.70; voxels = 45,836).35 Spearman rank correlation test also revealed that mean FA values for significant clusters in PD patients correlated positively with DiAcSpd (r = 0.63, p = 0.003).
Analysis of Polyamine Metabolism-Associated Genes
Next, we genotyped 19 SNVs to investigate whether variants of 3 genes (SAT1, SAT2, and HDAC10) that encode enzymes associated with synthesis or acetylation/deacetylation of Spd and Spm affect polyamine metabolism in patients with PD.